
Linear Fit Index:What is the Linear Fit Index?
Q: What is the Linear Fit Index?
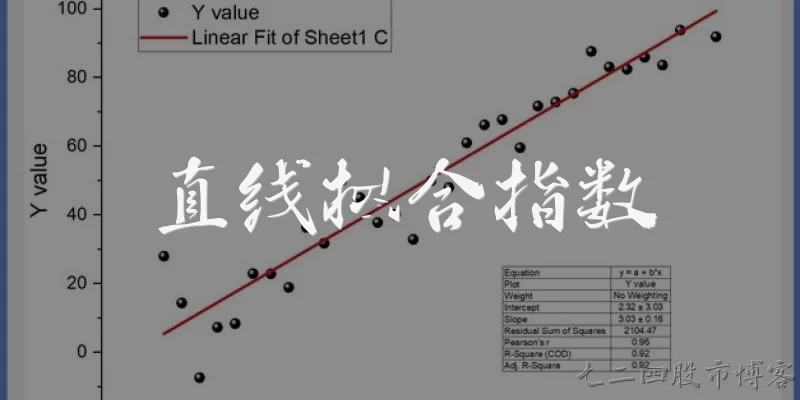
A: The Linear Fit Index (LFI) is a statistical measure that quantifies how well a linear model describes the relationship between two variables. It is often represented by the coefficient of determination, R-squared, which ranges from 0 to 1. A value close to 1 indicates that the linear model explains most of the variance in the data, while a value near 0 suggests poor fit. The LFI is widely used in regression analysis, trend detection, and quality control to assess the strength of linear correlations and to compare different models or datasets objectively.
Q: How is the Linear Fit Index calculated?
A: The Linear Fit Index is typically calculated as R-squared, the square of the Pearson correlation coefficient. First, compute the correlation coefficient r between the independent variable x and dependent variable y. Then square it: R² = r². Alternatively, R² = 1 - (SS_res / SS_tot), where SS_res is the sum of squared residuals from the regression line and SS_tot is the total sum of squares from the mean. The result ranges from 0 to 1, with higher values indicating a better linear fit between the variables.
Q: What does a high or low Linear Fit Index indicate?
A: A high Linear Fit Index, close to 1, indicates that the linear model captures most of the variability in the dependent variable, suggesting a strong linear relationship. A low value, near 0, means the linear model explains little variance, implying weak or no linear association. However, a high LFI does not prove causation; it only shows correlation. Also, a low LFI might still hide a perfect non-linear relationship, so it should be complemented with residual plots and other diagnostics before drawing conclusions about the data.
Q: When should the Linear Fit Index be used?
A: The Linear Fit Index is appropriate when analyzing whether two continuous variables have a linear relationship, such as in simple linear regression, trend analysis, or calibration curves. It is useful for comparing models, assessing goodness-of-fit, and communicating the strength of linear association. However, it should not be used for non-linear relationships or when outliers strongly influence the data, as R-squared can be misleading. It is also not suitable for categorical variables. Always inspect scatterplots and residuals alongside the LFI to ensure valid interpretation.
Q: What are the limitations of the Linear Fit Index?
A: The Linear Fit Index, or R-squared, has several limitations. It does not indicate whether the linear model is appropriate; a high value can occur with a non-linear pattern. It is sensitive to outliers, which can artificially inflate or deflate the index. Adding predictors always increases R-squared, even if they are irrelevant, so adjusted R-squared is preferred for multiple regression. Additionally, R-squared does not measure prediction accuracy or causation. Therefore, it should be used with residual analysis, domain knowledge, and other metrics for a comprehensive evaluation of model fit.
Dialogue about
Common scenarios of "Linear Fit Index"
【Data Scientist】 Hey, I've been working on a linear regression model and I keep hearing about the 'Linear Fit Index'. Can you explain what that is?
【Statistician】 Sure! The Linear Fit Index is often referred to as R-squared (R²). It measures the proportion of the variance in the dependent variable that is predictable from the independent variables.
【Data Scientist】 So it's a goodness-of-fit measure? How is it calculated?
【Statistician】 Exactly. R² = 1 - (SS_res / SS_tot), where SS_res is the sum of squares of residuals and SS_tot is the total sum of squares. It ranges from 0 to 1, with 1 indicating a perfect fit.
【Data Scientist】 Is a higher R² always better?
【Statistician】 Not necessarily. A high R² doesn't imply the model is good; it could be overfitting. Also, R² can be misleading if the model is used for prediction outside the range of the data.
【Data Scientist】 What about adjusted R²? I've seen that too.
【Statistician】 Adjusted R² adjusts for the number of predictors in the model. It penalizes adding variables that don't improve the model. It's calculated as 1 - [(1-R²)(n-1)/(n-k-1)], where n is sample size and k is number of predictors.
【Data Scientist】 So adjusted R² is more reliable when comparing models with different numbers of predictors?
【Statistician】 Yes, especially when you're adding more variables. But keep in mind that adjusted R² can decrease if the added variable doesn't contribute enough.
【Data Scientist】 Are there any other fit indices for linear models?
【Statistician】 Yes, there's the Root Mean Square Error (RMSE), Mean Absolute Error (MAE), and sometimes the F-statistic. But R² and adjusted R² are the most common for linear regression.
【Data Scientist】 What about when the relationship isn't linear? Can R² still be used?
【Statistician】 R² can be computed for any model, but its interpretation changes. For non-linear models, it's still the proportion of variance explained, but it might not be the best metric. Other indices like AIC or BIC might be more appropriate.
【Data Scientist】 I see. So if I have a low R², does that mean my model is useless?
【Statistician】 Not at all. A low R² might still be meaningful if the goal is inference rather than prediction. Also, in some fields, like social sciences, low R² values are common and still provide valuable insights.
【Data Scientist】 How can I improve the R² of my model?
【Statistician】 You can add relevant predictors, transform variables, or use polynomial terms. But be cautious of overfitting. Cross-validation can help ensure the model generalizes well.
【Data Scientist】 Thanks! That clears up a lot. I'll also look into adjusted R² and cross-validation.
【Statistician】 You're welcome! Remember, no single metric tells the whole story. Always consider the context and the purpose of your model.